| A Net Energy Parable Revisited | The Oil Drum: Net Energy | REVIEW: A Preliminary Investigation of Energy Return on Energy Investment for Global Oil and Gas Production |
The Net Hubbert Curve: What Does It Mean?
Posted by David Murphy on June 22, 2009 - 10:30am in The Oil Drum: Net Energy
Cutler Cleveland of Boston University has reported that the EROI of oil and gas extraction in the U.S. has decreased from 100:1 in the 1930’s to 30:1 in the 1970’s to roughly 11:1 as of 2000 (Figure 1). But beyond the fact that society receives currently around 11 barrels of oil for every 1 barrel that it spends getting that oil, What does this mean?
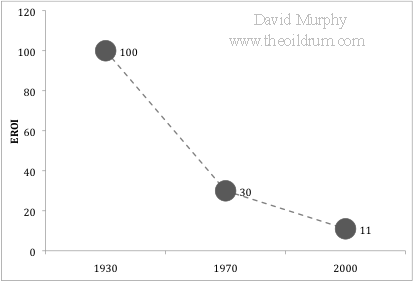
Figure 1. Plot of three estimations of EROI for U.S. oil and gas.
Well, first, it means that, if the trend of declining EROI continues, society will be spending an increasingly larger chunk of their remaining energy to get more energy. This cycle is positively reinforcing:
Declining EROI means that the net energy contained in each unit of energy delivered to society is decreasing over time, requiring the extraction of increasingly greater quantities just to meet societal demand →
decreases the quantity of energy remaining in the ground for future society →
makes it more difficult to find and develop the remaining bit of energy.
With every barrel we pull out of the ground we propel ourselves further down this path, creating a more difficult situation for future generations. (note: I assume that the “Best First Principle” applies to this scenario, i.e. society is using the best resources (i.e. oil fields) first, then the second best, etc…)
More importantly, declining EROI also means that the amount of discretionary energy available to society is FAR less than that predicted by a Hubbert curve (Figure 2). The Hubbert curve represents the total gross quantity of energy available, and, as it is calculated, there are equal quantities of energy available on the left and right side of the peak. This, however, is only true in a gross sense. The net energy available (i.e. discretionary energy) is less. In other words, declining EROI means that there will be much less net energy extracted post-peak than pre-peak on the Hubbert curve.
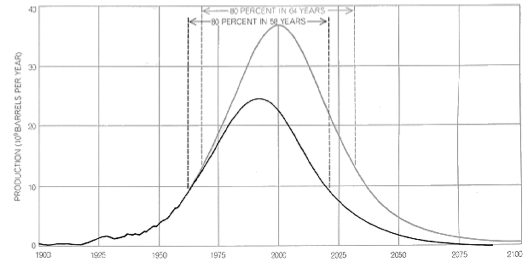
Figure 2. Hubbert curve as published in 1971. See here for a more detailed discussion of M. King Hubbert and this graph.
To understand this in greater depth, I quantified this relationship by first creating a replicate of the Hubbert curve published in 1971 (Figure 2). I then applied the three point values of EROI over the past century (i.e. 1930 = 100:1, 1970 = 30:1, and 2000=11:1), and interpolated linearly the values between the points and into the future to a minimum EROI of 1.1:1. I have no a priori reason to believe that EROI has declined linearly or that it will decline to 1.1 and then level off, but it has certainly declined in the past and as long as it is declining the general results reported here are valid.
I then used the following equation to calculate the percent of net energy available from the gross energy produced:
Figure 3 shows the results of this analysis. Unlike the original Hubbert curve that shows equal quantities of gross energy resources on the left and right side, the Net Hubbert Curve is skewed so that most resources are on the left. For example, according to the original Hubbert curve, 50% of the energy resource is remaining when production levels reach the peak, but this is quite different for the Net Hubbert curve. Due to declining EROI, by the time peak production is reached, 73% of the net energy available is already used.
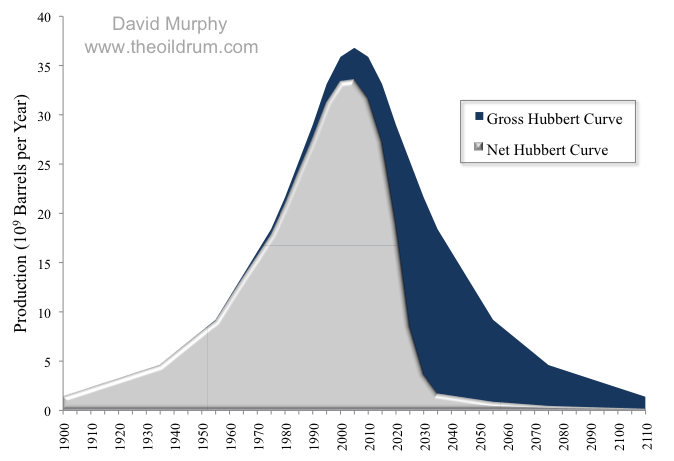
Figure 3. Gross and Net Hubbert curves, adapted from Figure 2.
The implications of these results are vast, but in general, declining EROI is going to make it very difficult to meet the net energy needs of future society. Although this study may not be very precise, it does imply that if we have reached Peak Oil (and I think we have), that society has already spent quite a bit more than half of the net (or discretionary) oil energy that will ever be available.
Contact
- theoildrumeroi at gmail dot com
Personnel
Archives
- October 2010 (1)
- September 2010 (1)
- August 2010 (1)
- July 2010 (1)
- June 2010 (1)
- April 2010 (1)
- March 2010 (2)
- January 2010 (1)
- July 2009 (1)
- June 2009 (1)
- May 2009 (2)
- April 2009 (1)
- March 2009 (1)
- February 2009 (1)
- January 2009 (2)
- December 2008 (1)
- November 2008 (1)
License

This work is licensed under a Creative Commons Attribution-Share Alike 3.0 United States License.
Whilst I agree with the main premise of this article, I think the calculation is too simplistic and based on far too few data points.
First, defining EROEI is almost impossible, because of where to draw the boundary. Each component of the energy input to the system to some extent IS the economy - if 10% of the population is economically supported in the energy industry, that is 10% of the population that does not need support within the rest of the economy.
Beyond that, my guess is that worldwide, the EROEI is higher than that for US developments, since the US is one of the most highly depleted oil producing regions in the world. Finally, I guess that the figures quoted are for new field developments, not an average figure for oil production as a whole, so that the bulk of oil from existing fields still has relatively high ROI, if you allow for sunk costs already invested.
So I suspect a more realistic graph whould have a slightly less steep energy cliff, but an energy cliff none the less.
And finally, to contradict myself, any complex society faced with such an energy cliff would do very well not to collapse completely, and would probably contract so fast that it will end up leaving most of the oil in the ground anyway, as the economy could not support the massive up-front investment to build the infrastructure needed to exploit such difficult to extract resources.
Actually I doubt that the Hubbert curve does actually peak at 50% URR - Hubbert knew nothing about recently introduced innovations like horizantle drilling. For example, the UK, an area recently developed using these techniques appears to have peaked at around 70% using Government figures for URR.
So, due to technology Hubbert becomes a shark fin, due to EROEI an even sharper descent post peak, due to ELM Net exports .... oh dear!
Xeroid,
I agree. I wanted to keep this post succinct so I did not venture into different Hubbert shapes etc., but the gross vs. net relation still exist as you point out.
I guess you could argue that the US--and other post-peak oil importers--are facing a "squeeze play," between declining domestic production (at a lower EROEI) and a long term decline in net oil exports.
The focus of our upcoming update to the top five net oil exporters paper is annual net export rate versus cumulative remaining net oil exports. For example, using 1996 as a final production peak, Indonesia's net exports in 1998 were only 9% below their 1996 rate, but by the end of 1998 they had shipped 44% of post-1996 cumulative net oil exports.
Xeroid:
"So, due to technology Hubbert becomes a shark fin, due to EROEI an even sharper descent post peak, due to ELM Net exports .... oh dear!"
This is the quintessence of this topic. Scaring.
See my other post its not quite that bad :)
Its not quite additive :)
Not sure the differences are all that important however :)
It would be interesting to see a graph of NET energy available to society given EROI declines even if the Cornucopians are right and we can stay on plataue or even lift Gross Oil output to 2030...
Then toss in declines, ELM, the four horsemen, to get a range of scenarios...
Nick.
Well the shock model by WHT can model this the problem is the data. I think Web has nailed something very fundamental for modeling complex systems.
Briefly when I used to model chaotic systems we worked very hard to make sure initial conditions where random in all directions. In my opinion the beauty of what Web has done is recognize that you can shape the initial conditions such that they are not evenly distributed thus the input effects the output.
This shaped pulse is in a sense a simple model for a complex system !
However this leaves open the problem of how to shock the model. Dispersion is and obvious first order shock but then what ?
And next we simply don't have the data.
It might be possible to take the raw data and guess the shocks something along the lines of a Fourier transform.
I don't know if web has looked at deconvolution i.e run the shock model in reverse.
As and example instead of using discovery data to mean production use it to mean capacity. And although the data is incomplete it does work to constrain the viable solutions. And of course we have hard data from above ground events. How the system rebounds from and above ground event helps to narrow the possible outcomes.
Web of course has known this all along but it just recently hit me that the shock model is fundamentally valid for modeling complex systems.
Ivanhoe on Hubbert 1997
-------------------------------------------------web/20060902171235/hubbert.mines.edu/news/Ivanhoe_97-1.pdf
Hubbert says: “The curve does not keep going up, but passes over a hump and then goes back to zero. This is the one
future point on the curve that you definitely know and it greatly facilitates the mathematics. The area
under the (production) curve is graphically proportional to the amount of development. The area under
the curve cannot exceed your estimate. It is a very simple, but very powerful method of analysis.”1 “This complete cycle has only the following essential properties: The production rate begins at zero, increases
exponentially during the early period of development, and then slows down, passes through one or more
principal maxima, and finally declines negative exponentially to zero. There is no necessity that the
curve P as a function of t, have a single maximum or that it be symmetrical. In fact, the smaller the region,
the more irregular in shape is the curve likely to be. On the other hand, for large areas such as the United
States or the world, the annual production curve results from the superposition of the production from
thousands of separate fields. In such cases, the irregularities of small areas tend to cancel one another and
the composite curve becomes a smooth curve with only a single practical maximum. However, there is no
theoretical necessity that this curve by symmetrical. Whether it is or is not will have to be determined by
the data themselves.”2
------------------------------------------------
Ivanhoe says:" Hubbert wrote virtually nothing about details of the “decline side” of his Hubbert Curve, except to mention that the
ultimate shape of the decline side would depend upon the facts and not on any assumptions or formulae. The decline
side does not have to be symmetrical to the ascending side of the curve - it is just easier to draw it as such, but no rules
apply. The ascending curve depends on the skill/luck of the explorationists while the descending side may fall off more
rapidly due to the public’s acquired taste for petroleum products - or more slowly due to government controls to reduce consumption."
Yep and just like my brief foray into mathematics I busted my ass to discover this only later to find out
that the Gods has already figured it out :(
However the fact that I independently reached the exact same conclusion should be of importance.
I'm sure over the next few years a lot more people are going to understand in painful detail what these paragraphs mean.
When Oilmen state things like "There is enough oil left in the ground to maintain current rates of consumption for X years" there is an implicit assumption that if no new oil is found then at the end of 'X' years there will be a cliff down to zero.
Any new oil found simply extends 'X' a bit, makes up for any drops in current output or raises the 'current rate of consumption' variable when translated into pumped oil...
I guess it is highly unlikely to hear one of them say: "demand for our product will decline over the remainder of the century because its price will repeatedly become so high that fewer and fewer people will be able to afford the benefits it bestows" -It's just not good sales talk is it? :o)
Nick.
The rapid decline in the EROEI is a symptom of the shark fin.
If we where going to have a nice mirror image curve then EROEI would have stayed constant.
They are not exactly additive i.e declining EROEI and asymmetric production curves are almost the same thing.
Not quite but its a chicken and egg problem. Its not a shark fin extraction profile and a shark fin EROEI its both i.e your saying the same thing using different approaches.
My opinion is of course that EROEI is indicative that the shark fin model is correct i.e its a measurement one would expect if you are having a shark fin extraction curve but no one believes you :)
With that said export land is additive on top of the production curve. And in a sense the EROEI does add a bit to export land i.e more oil is being burned internally to extract oil so it makes export land worse. So in a sense export land is also a bit of a double measure i.e you need to subtract the increasing internal use in the oil exporting countries thats a result of declining EROEI.
Of course a country facing falling real production can also claim questionable increases in internal consumption to hide decline. KSA's consumption changes are questionable for example.
This does not detract from the calculation of next exports it does not care what the real reason is for the decline in exports it works even if numbers are being faked.
However I'd argue its underestimating the decline rate since certainly part of the change is rising internal demand thus this will continue even as production falls. In short the real decline in net exports should be accelerating making westexas's current model optimistic. Of course at some point we will see overall net export decline to the point that prices will increase and drive true internal demand while the shark fin model implies real net oil production will be falling rapidly if you add in EROEI concepts.
So you can see how all three concepts have some overlap i.e they are doing a bit of double counting of the same underlying lack of oil but they are also additive. EROEI and Export land mix in the underlying shark fin decline but in doing so they are also symptoms or additional measures on top of the underlying decline so they are not pure double counting.
Whats import is that two reasonably different measures independent of assumptions of the real production profile in my opinion point towards the shark fin profile as being correct.
And net exports is and obvious shark fin.
I agree that the work is simplistic. The main point of this post is to stress the fact that NET and GROSS energy are vastly different, but not necessarily that one is "X" more than the other.
David -- At this point I think simplistic is a good way to go. As other have pointed out the actual calculation of EROEI is complex and, more important IMO, very subject to how you choose to model the set up. I also don’t think such a calculation based upon energy quantities is the key. The economics that determine drilling operations isn’t based upon energy volumes. The process is evaluated strictly on $’s vs. $’s out. Not that there’s a complete disconnect between energy content and $’s. But the actual FF energy used to drill a well is generally a rather small portion of the total operation. An extreme example: Time A prime rate = 16% and Time B prime rate = 6%. Same prospect…same EROEI 5:1... same oil price. But during Time A the well won’t be drilled because the cost of financing drives the return to less then 0. And then there’s Prospect X with an EROEI of 1 but a spike in oil prices pushes the economics to a 20% rate of return so it gets drilled.
This isn’t an argument against EROEI and its implications. But the oil industry has never based decisions upon EROEI and never will IMO. That adds another reducing/addition factor to your net model. Today many potentially viable NG projects are not being drilled even though their EROEI might be attractive. Current low NG prices won’t allow drilling. In that sense low commodity prices generate what one might call an artificially low “effective” EROEI. Similarly, high oil prices last year almost certainly caused a number of potentially very low EROEI oil projects to be drilled.
Will we ever drill projects with EROEI’s less then 1? Low or even negative EROEI is possible when look at the net process. It’s possible when you factor in the energy component from UNSUCCESSFUL projects. That’s the nature of oil exploration: high prices spur drilling but the success rates falls quickly as the greed factor generates a large percentage of poor prospects. The price spike of the late 70’s led to 4600 rigs drilling…twice the number drilling when oil prices peaked last summer. I can promise you half those rigs were drilling crap and generated no reserve gains. But they burned up a lot of $’s and energy in the process.
I wouldn’t try to model the economic effect on the Hubbert Curve. Too many Y’s in the road. But it would probably be good to keep in mind that the tail of the curve will be determined by more then just the physical presence of a certain volume of oil. Your curve does an good job of that IMO. As you imply it’s not meant to be a quantitative prediction but does offer a qualification to Hubbert’s original projection.
And for the comment regarding Hubbert’s blindness to future new oil trends bear in mind that he had no clue to the huge potential we developed in the US offshore shallow water plays let alone the Deep Water plays currently being developed. But his very old curve for the US still works fairly well.
All economic activity is about $s and making a profit and consumers affording the required price, oil is no exception.
It's the inability to afford the price that will eventually deter consumers from using the oil for energy use, as we have already seen in the last few months - the price is all they need to make their decision.
The expected shape of Hubberts peak due to geology, EROEI and ELM just allows us to predict that the price has to become completely unaffordable for energy use much more quickly than most people suppose.
From reading his paper I think Hubbert was correct about the peaking phenomenon, got lucky about the timimg of the US peak and was completely wrong about the volume at peak because, as you say, his knowlege of actual reserves, their flow rates and their affordability was unknown to him, just as they are to us.
I am inclined to at least partly agree with this. Part of the reason the US peaked is because there was easier (cheaper) to extract oil elsewhere (ME). Had there been no alternative I don't see why they could not have kept production increasing for several more years. I say this because almost 40 years after peak there is still significant production. There is no reason production could not have been kept increasing, albeit at the expense of a later and steeper decline.
BTW I think this is in general true. I.e. later fields are experiencing accelerated production (i.e. above what Hubbert's symmetrical curve would predict) because later fields are increasing capital intensive to produce. Therefore accelerated production is required to get the needed IRR, i.e. recapture investment and profit quickly enough to attain the IRR. Another reason Hubbert's bell is skewed (and us too, with an 'r').
Also, on the theme of declining EROEI, it is important to remember that not all the E(in) will be from oil. Much of it will be from gas, coal, nuclear etc. Of course each of these are also facing declining EROEI values in the same time frame, but not all. The EROEI for hydro is probably fairly constant, for renewables it is probably rising with improving technology, and even with nuclear, it might not be falling.
However, coal, oil and gas represent over 80% of primary energy supply worldwide, and their EROEI are (probably) all falling. Certainly coal is.
It should not be too difficult to combine crude figures (sorry for the pun) from each energy source to give a better estimate of what I call 'peak net energy' from all main energy sources. I suspect it will not be more tha a decade or two in the future.
Also he couldn't anticipate the Yom Kippur War and the Iranian revolution...I would say that it was rather a pretty nice shot.
Many times a good way.
The rata of EROEI decline cannot be a simple interpolation IMO, see my post below. I think a better approach is to take a look at the increase of E(in) over the decades to get the samo amount of E(out).
EROEI is not 'real'. It is a direct result of the proportion between E(out) and E(in). So while I titally agree with your basic idea, I'd use E(in) instead of EROEI. In other words: I do agree with you that E(net) declines a lot faster than E(out), but I don't think it wil be as steep as your graph shows.
More details below.
According to the EIA we've drilled 3164170 dry holes in the US since 1949, if you want another data point.
Quite the energy sink.
Nice framework David. This is exactly the kind of thing I hope to dig deeper into this year, starting at SUNY-ESF.
I have been writing about this phenomenon for a while now.
Biophysical Economics.
I started proposing that what we are witnessing in the financial/economic systems are a direct reflection of decline in net energy to do economic (non-energy production) work.
George
That's as close as dammit to a cliff as I'd like to get...
I mean basically by 2030 -a little over 20 years- it implies there will essentially be next to zero oil left for anything other than scrapping more out the ground and absolute civilisation 'essentials'... This IS the Mad-Max scenario...
Nick.
David: I can't say personally if your numbers are accurate, but assuming they are, figure 3 is one of the most mind blowing charts I have ever seen.
I've been seeing that figure 3 in my head for some months now (as per my references to net joules v gross barrels). Not sure I'm any happier seeing it spelled out on this page!--but congrats to Dave for getting it out there.
I suspect that simple inability to raise output has been more to the point recently, as a ten-percent "tax" to the production process shouldn't make a vast difference of itself.
David,
Losses after the well head(refining and transport) already account for most energy loss of gasoline and diesel actually delivered to consumers, rather than extraction. Some of these can be replaced by higher EROEI resources( renewable, nuclear) so while the overall EROEI will decline, the actual amounts of transport fuels may not decline very much. Just the same this implies much higher prices for oil based products versus say electricity generated by non-oil energy resources.
Neil1947
I agree that there are large energy losses post-well head. We have actually written a paper on the subject, which can be accessed here.
However, I would say that most of the [viable] renewable options out there provide electricity, not transportation fuel.
I strongly disagree !
Seen in the light of EROEI as this post is about my understanding goes like this :
After well head :
EROEI is (almost) constant over time. A refinery doesn't take more energy to refine a barrel than 100 years ago (in principle) ,transport/volume/distance energycost "same" as 100 years ago, and so forth ...
What takes some more energy here is to bring Deep Water oil to the shore (only?)
Before well head today:
Short story ....
-search, locate, evaluate ... eventually and viola "Deep water sub salt" (or oil-sands)
-therafter develope with necessary eXtreme-infrastrucures in place - with alot of embedded energy
-but remember there is little gain in looking for oil in places already searched 100 years ago. You must look for it in new and more difficult places.
-more: EOR takes alot of energy INput (... ohh sure to get more OUT). But this happens before "after the well head"
In sum, all these procedures will subtract from the NET energy portion left over for "fun", to a far greater extent than "before".
Paal myrtvedt
The energy costs pre-wellhead have certainly increased, as you have pointed out, but so have the post-wellhead costs. Furthermore, as the boundary of analysis is extended beyond the wellhead, the energy inputs increase dramatically. As we have written about in our paper "What is the Minimum EROI that a Sustainable Society Must Have?", post-wellhead energy costs within just the transportation industry, i.e. road maintenence etc., bring the EROI of transportation fuels, which were 10:1 at the wellhead to 3:1 at the consumer.
David, I have not read your paper, maybe I should, but transportation industry - road maintenence etc is part of my "fun" definition above (aka running this modern world, Wall street and all), and hence is not subject to any EROEI calculations regarding oil as such (IMO).
Furthermore I reckon refineries and other included processes are at least equally efficient today as compared to those same (needed) a 100 years ago. Probably efficiency is better today, at least not worse .... any how, now to my point : Whatever happens to oil after well head is mandatory stuff in order to utilize oil, it has to be refined - it has to be transported , and I can not see why this should take more energy today (volume/distance) than 100 years ago ?
You are talking about losses in refining/transport .. ehhh ...what does that actually mean ? Have you proposals to increase efficiency or ..?
this one puzzles me too:
Are you implying that 3.33 out of 10 barrels are "lost" between wellhead and consumer ? And if so ... isn't this "loss" only part of the mandatory energy usage in order to conduct BAU ?
The Internal Combustion Engine has about 80% losses (to heat) - BUT it is still widely used. It simply comes with the concept and few actually see it as a loss - the same goes for oil after wellhead.
And as for your claim that renewable/nuclear-EROEIs will somehow help to ease the "losses" ... I'd say : What ??? Sorry David, I'm simply not getting these thoughts.
BUT your main article was spot on, thanks !
Where did I say that?
Just because the energy costs are "mandatory" doesn't mean that they should be excluded from an EROI calculation. Historically, most EROI calculations use the wellhead or minemouth as the boundary, but as that boundary is extended, then other costs have to be included. For example, extending the boundary so that the energy out is "gasoline at the pump" would mean that energy inputs up to that point must be included, such as road maintenance and vehicle maintenance that are necessary to use the gasoline.
Hi David, I'm sorry, your first blockquote's claim here was issued by Neil1947 - my bad ! , hence he must argue that fly-high claim.
Then on to your second paragraph -
Dave : "Historically, most EROI calculations use the wellhead or minemouth as the boundary..."
This makes sense to me b/c at wellhead/minemouth we have secured a unit of oil or coal at a certain effort - today this effort is much greater than a 100 years ago - energywise that was. So due to these effort-differences we can calculate an EROEI number to see where this "all go".... and ultimately where/when it will end -due to thermodynamics , so to speak. AND as you know an EROEI=1 is a showstopper- in practical termes some time before this ...
The portion "pre-wellhead" is the important part - b/c this is the process which determines if we have someting or not and for how long .EROEI helps us in the planning part one may say.
Whatever EROEI-issues you and others may find "important" post-wellhead is beyond me. I more or less don't see what it actually is. I can see some gains in streamlining crudeoil trade/shipping - as in lands buying it's needed oil fron nearby sources and such -
My "mandatory" above is also a FIXED - more or less. So it's the FIXED part I don't bother to calculate. It is what it is !
- likewise I don't think to myself every other minute of my life that "ohh how lucky I am to have air to breathe .... " Some calculations are simply not needed - and I have a gut-feeling that you confuse post-wellhead EROEI with efficiency or how society should prioritize oil -some how
***EDIT :
I think you need a new term for what you call EROEI post wellhead ... let's see ...
what about ELFEOS - Energy-Left-from-Energy-Obligatorily-Spent
(...as mentioned above - for a car with an ICE , ELF is 20% for propultion thus 80% is lost as heat or EOS. You are not getting your propultion without wasting the heat)
The Hubbert curve we have seen, historically, has been at a more or less constant price. Mineral reserves tend to grow exponentially with price, which implies that there is a good likelyhood that the EROEI for oil should be logarithmically extrapolated, rather than linearly. Then we don't have that cliff - rather the opposite - reserves will increase post-peak due to increased price, while EROEI won't change much.
Two regions, developed by private companies, using the best available technology, with virtually no restrictions on drilling--Texas & the North Sea. The 1972 Texas peak and the 1999 North Sea peak are lined up with each other in the following graph. In both cases, the initial declines corresponded to rising oil prices--about ten-fold from 1972 to 1981 for Texas, and about five-fold for the North Sea from 1999 to 2008.
any idea on what the marginal barrel costs in north sea now?
No, but the production/price relationships in both case histories, during the time frames shown, are pretty interesting. Basically low, stable oil prices corresponding to rising production and falling production corresponding to higher oil prices.
We tend to find the biggest fields first, and when those fields peak, total conventional production in a region (e.g., Texas, total Lower, 48, North Sea, etc.) tends to fall, regardless of price. And when Saudi Arabia and the world are at the same stage of conventional depletion at which these regions peaked, they should show similar production declines, pretty much regardless of price (at least in regard to conventional production).
Westexas, North Sea and Texas,these are still the strongest cases for peak and for what must occur with what we now call "oil". The difficulty in prediction is the timing...after the fact both North Sea and Texas indicate what MUST happen sooner or later in any oil field. Peak world could occur on any day...the day may have already occurred (we can't know until years after) or it may be some decades away...either way, the outcome is not in doubt.
Remember the iron rule "peak may occur on any day", and then you must have the disquiting revealation...why not today? One day is as good as any other. Even more disquiting, we simply can't know. This is why the Hirsch Report will turn out to be the last study we ever really need to do on peak oil. Now, we build the new alternatives to fossil fuel (because even after fossil fuel taps out, we still live in a sea of energy), or we sink backwards to primitivism. Which path we choose is up to us, all of us collectively. The oil age is effectively over, it is now runnning on momentum as a deer that has been shot can "run dead" on muscle reflex for over a mile (all hunters have seen this).
RC
As we have discussed very often, the pre-peak Texas HL plot is pretty noisy, but the pre-peak Lower 48 HL plot is very stable. Also, the pre-peak North Sea HL plot is quite stable. Based on their respective HL plots, both the Lower 48 and the North Sea peaked when they were about 50% depleted.
And as Deffeyes noted, the world in 2005 was where the Lower 48 and North Sea were at in 1970 and 1999 respectively, and the world--even with some contribution from unconventional production--has shown a cumulative shortfall between what we would have produced at the 2005 rate and what we actually produced, 2006-2008 inclusive (C+C in all cases). Furthermore, the initial three year declines for the Lower 48 and North Sea were quite low, followed by a more rapid decline. I suspect that the decline in worldwide demand is masking an accelerating conventional production decline rate.
.
...or for the Geologists amongst us:
:o)
Nick.
K001 :-)
jeppen -- your observation is valid to a degree IMO. Higher prices will lead to more oil extracted. But be caustious with that projection. As I pointed out above higher prices also lead to a big increase in failure rate. In my 35 years in the oil patch I've seen more money lost during high price periods then made. The big profits have always come from reserves developed during low price periods (with associated low drilling costs) which then roll into a high price period. Just look at all the oil and NG investaments made last summer based upon prices that were 3 to 4 times higher then what we had just 6 months later.
Like much of life: timing is the key.
Right this is why mixing money and EROEI simplistically is probably not correct.
EROEI has a interesting result because it says that at some point price does not matter.
Same of course for regular geologic decline. At some point even if oil went to 1000 a barrel we will simply extract less oil.
Its better to think in the big picture as decline continues and EROEI declines we have to invest more in oil extraction for lower and lower net return. This means we will have less to invest in the future.
What really happens is the absolute amount that can be invested declines regardless of the price of oil.
The higher it goes the less the overall economy has to invest in more oil.
Think about it like this.
You buy wood and build a house and sell it for X the price of wood goes up so you raise the price at some point your customer can no longer afford to pay. Its not just the end consumer but also money for investment.
Now the price of houses may keep increasing fine but we will build fewer no matter what because the wood supply is in decline. Price simply can't induce more wood to come into existence. You can't get wood out of a turnip :)
I think we will see we hit stage two i.e rising prices will result in lower and lower reinvestment in the oil industry. As you noted more money is lost during high price periods and a sustained high price period should quickly sour the desire to invest in oil as people lose their shirts. Again its simply because you can't throw money at the problem and fix it. So paradoxically the money must be lost.
At some point we simply can't afford to invest more money into oil esp if its negative EROEI.
Its not simple but as long as you focus on the fact that no amount of money can change the amount of real oil in the ground you see that simple price arguments vs EROEI and natural decline are wrong.
memmel -- I wonder how many folks believe us when we tell them about the inverse relationship between oil prices and making money. I suspect that same relationship exists in other commodity plays. Most folks can't believe that it was the oil price spike of the late 70's that led to the destruction of much of the industry in the early 80's. For me, sitting in the middle of the train wreck, it was obvious.
Same old saw: buy low - sell high. The greatest financial success I've ever generated was in the mid-80's when NG was selling for $.90/mcf. But I was drilling it up for $.15 - .25/mcf. Oddly enough I may be on the verge of riding the inverse again. In August I'll begin working for a venture capitalist who wants to play the contrarian angle: invest $200 - 300 million over the next few years so he can flip the company when prices run up again. He learned from his past mistake: lost almost $200 million by investing during a high hype period. With some smart moves and a little luck this new effort will carry me through to retirement. I'm ready....this roller coaster ride takes a toll on soul.
LOL :)
I've had the same experience its a bit funny to realize that the real money is always made at the bottom after all the credit and leverage is gone.
This fundamental of economics is sobering and real. You only make money by investing past profits into future endeavors. Trying to leverage by borrowing from the future to make money now always eventually fails.
This is really the heart of what EROEI says by taking from future returns for today eventually you simply can't take any more and your left with immense leverage.
One of the things I'm trying to tell people is we can't borrow from the future if we want to move to a renewable society we have to dramatically cut our current consumption and redirect this energy/money/people to building the future but we have to work within the constraints of what we have. This probably means elimination of all outstanding debt i.e a global jubilee. We simply can't support it. But it also means elimination of any future debt i.e not only are the current debts erased but your not allowed to take on new ones.
So sure you get your 500k McMansion but the problem is if you try to sell it the buyer has to pay cash.
I suspect you would be lucky to recover your down payment.
Although this may be shocking its just the first step or baby step we need to make before we can even work on the problems we face.
Now of course I doubt we do anything and the problem is of course the amount of energy we actually have to redirect to a solution is declining rapidly. I.e the longer we do nothing the less we have to do something.
My opinion is that realistically a complex system can only be made robust to decline during the expansion phase only by consistently redirecting the output to prepare for the future can you actually make the transition.
We would have had to have in a sense saved for this time its a black in white problem either we prepared or we did not nothing feasible can be done now to change the situation.
Its like Egypt of old with 7 years of plenty and 7 years of lean. If you did not prepare your toast.
Only once we recognize that regardless of what we do we are toast can we potentially do something drastic enough to give a less painful outcome. We can't escape but we can lessen the impact.
In the Egyptian case one answer not explored in the Bible was to expel a large precentage of the population or disperse them.
I bring this up because and obvious answer to our problems is to adopt effective birth control then redistribute our population such that its sustainable with intensive organic agriculture. Small amounts of renewable energy can be used to provide advanced technology i.e PV for cell phone and one light bulb etc.
In fact the answer to the problem seems to require a dispersion event. My debt jubilee is a dispersion of wealth etc. Without one you seem to have no solution. You have to disperse the current wealth the people etc etc and redistribute everything to create a resilient base.
I suspect this is what socialism saw that if you simply redistribute you can build a truly wealth base the problem is it failed to take the next step redistribution was just the first step the harder problem is to prevent re-concentration of wealth. Although in general leverage fails this does not mean it does not work to initiate wealth concentration not by working but by destroying the wealth of the stupid leaving the winners with more.
Jeppen - two points:
First, the author clearly states that he has no reason to prefer a linear extra- or (in his own words) interpolation, it's done for expediency and doesn't affect his point; his point requires only that it be declining.
Second, from what you're saying you don't appear to have understood what ERO(E)I means. With increasing price, exponentially larger mineral reserves become economically viable, yes. But this does in no way imply that they have become easier to extract. Quite the opposite, actually: It implies that we want them more badly, and are willing to spend more resources - real and financial - to get them. You must assume that these larger reserves have a substantially lower EROEI.
Jeppen,
This may be true for the QUANTITY of some minerals, but it does not apply to the QUALITY of the mineral, as KODE points out. For example, in the early 1900s the United States was mining copper ore that was about 4 percent copper. By 1969 that had dropped to about 0.5 percent copper because the best resources had been mined (Lovering 1969).
It affects his striking graph very much. The cliff will disappear.
Of course not. If price doubles, I expect the (marginal) metal (or whatever resource) have become twice as hard to extract. But there is much more such minerals - for uranium, a tenfold increase in price (ten times more diluted marginal ores) creates 300 times larger uranium reserves. If the EROEI of uranium (or oil) is sufficiently high to begin with, then a halving of EROEI may not pose that much of a problem while expanding reserves a LOT. Looking at unconventional oil, this seems as true for oil as for uranium.
Jeppen: What you are saying is that the strength of the global economy is in no way affected by the cost of energy-if your basic premise is correct, then all discussions on this subject are irrelevant. In your model, where does this limitless and ever increasing supply of wealth originate (to effortlessly pay higher and higher energy costs without consequence).
The price of oil is not relevant; Net Energy is.
If it takes one barrel of oil to extract one barrel of oil, the fact that oil is $1000/barrel will not change the net energy gain of 0.
http://www.chrismartenson.com/crashcourse/chapter-17b-energy-budgeting
Oh $hit!
It is even worse than this, because a similar phenomena applies in the financial dimension. As the best first protocol is applied, what remains is increasingly difficult and expensive to find, develop and extract. Payback periods lengthen, eventually to impossibly long periods, or to periods that approach the useful life of the capital investment (effectively the same limit in the financial dimension as is an EROI of 1.0).
The conclusion is that it doesn't really matter how much might theoretically be underground, the only thing that matters is how much is actually going to be economically feasible to recover, and that is going to be considerably less than 100% of what might be theoretically and technically possible to recover.
The other thing I would note is that the growing differential between gross and net is custom designed to allow for maximum obfuscation and deception by government and corporate authorities. We are almost certain to be told that things are much better than they really are for far too long.
Yes. Cheap energy ia an essential component of a powerful global economy. As cheap energy disappears, the overall strength of the global economy declines, which makes the demand for energy decline, which makes more expensive (lower EROI) deposits less profitable to develop, which further slows the overall economy, etc.etc. Projections of $1000 barrel oil (in 2009 dollars) bypass this aspect of the global economy. The global market for $1000 oil is so small that it is unlikely companies will want to develop reserves that cost e.g $950 a barrel.
BrianT: keep repeating this message it's the key to understanding the long slow decline ahead although I am certain it is likley to get dressed up/masked with various proxy issues like financial collapses, wars, etc.
Nick.
Nail? Meet hammer.
Nice nutshell, Brian!
While we would like to believe that we will have a bumpy plateau or some other stupor inducing outcome, the truth is the crash will be swifter than the incrementalists would have it.
This graph and the concept behind it confirms what I've been saying on this site since day one: the time to back out of the technological cul-de-sac is now while the energy is relatively cheap.
As long as the technophiles hold out for magical bullets and BAU promises to the gullible, we will find ourselves tumbling down the steep side of the cliff with no suitable landing spot.
Dave,
Good article.
I was looking through Al Bartlett's exponential population lecture on youtube(6th video about half way through)http://www.youtube.com/watch?v=9oalwwtlYjE&feature=related and I saw something I hadn’t noticed before. He said we have already passed peak energy consumption and supply on a per captia basis many years ago in the 1970’s at above 2 liters per person per day. He was taking the world production and dividing it by the world population in a given year. The average consumption back in 1999 was 8 liters per person per day in the U.S. The world average consumption was 1.7 liters per person per day.
To quote Mr. Bartlett
“I think historians in the future will look back at that the peak(per capita) in the 70’s was a major turning point in all of human history. That’s the point where per capita petroleum consumption reached its peak before it started its inevitable decline and there is no way I can see that we can reverse that trend given world population growth and given we are close to peak petroleum production.”
nice work david
of course, the EROI for the USA presumably will fall faster than for World, but you extracted Cutlers #s for USA onto world Hubbert curve, which may be aggressive. Extrapolating the drop from 100:1 to 30:1 to 11-17:1 (midpoint) gives you this for USA (red is gross production - blue is net):
Note: we WILL produce oil at energy break even or lower if oil has a magnitude higher of energy quality than its energy inputs (be they nat gas, solar electric, what have you). But that is in theory - we are in world of hurt if oil gets to energy break even - and this will happen much faster than pundits think because a)pundits aren't even thinking about it (they look at 'resource') and b)the sunk cost of pipelines, rigs, etc. via bootstrap makes current EROI subsidized by historical sunk cost infrastructure -if we had to replace all drilling equip etc from scratch we might be approaching energy break even already...
Nate,
what do you think happens if you plot E(in) and E(net) on a graph, using the same timescale? It took 70 years for EROEI to fall from 100 to 30 (a change of 70), while E(net) changed very little. With a fiexed E(out) of 100 (say, percent), EROEI 100 means E(net) of 99 and E(in)= 1. EROEI 30 means E(in) = 3.3 and E(net) = 96.7 Not that big a change.
Then it took 30 years for EROEI to fall from 30 to 10 (a change of 20). In other words, E(net) fell from 96.7 to 90, but it took 30 years.
There indeed is an accelerating increase in E(in) if you wanto to mine the same (100) E(out), and I think this will accelerate further. However, I tend to think the decline in EROEI will become less steep as there will be an ever increasing E(in) to sacrifice in getting E(out).
True - but I think the fundamental tenet underlying the logistic/Verhulst equation when applied to oil is cost (or declining EROEI). So in a sense applying net energy to Hubbert Curve might be double counting. The other (unspoken) point is that we have replaced energy gain with debt/credit. The implication of that is that we will never have a high enough oil/gas price to get out the resources at a price that is affordable to social democracies. Bottom line is the 2-3 T yet to be recovered forecasts are likely to be off by factor of 2+...
Not quite the logistic equation would in my opinion represent simply less availability it does not implicitly imply lower EROEI.
As and example consider a forest on a flat plane cut down at a certain rate. The logistic implies the more you find the more you cut in other words your cutting the trees based on the amount remaining. The peak cutting rate is reached when the maximum number of lumber jacks cut the maximum number of trees subject to logistic growth then decline. As the tree count goes down the number of lumber jacks employed goes down.
Now the energy to cut the trees in this example is a constant i.e the last tree cut cost the same amount of energy as the first EROEI was constant.
Now declining EROEI may well result in more lumber jacks to cut less trees lets say instead of a flat plain your moving into a rugged region. But in this case peak production is not equal to 50% remaining and it depends on how many more lumber jacks are added. If each time it gets twice as hard to cut the trees you double the number of lumber jacks you can keep production constant if you double again you can increase production.
In the extreme of course if you assign a single lumberjack to each tree then you come them all at once.
Obviously logistic equations don't tell you which is happening i.e are you doubling your effort against lower returns ?
However if EROEI is declining and production is increasing this suggest that extraction is driven by the effort to extract vs the remaining resources and you in essence hit the wall where you have a large number of lumber jacks and a very small number of trees the moment lumber jacks out number trees you crash.
In effect this is what we have done most of the oil in the world is now associated with a well extracting that oil just like in my lumber jack example where in the end every tree had a lumber jack assigned to cut it down.
Production thus ends when theses wells run dry. I.e the final production lifetime approaches the same lifetime as a individual well.
So I'd argue that all you need to know to understand your production curves is if production increased as EROEI decreased if this happens then you know your throwing more resources at the problem and the extraction rate is controlled by the effort expended to extract. Available reserves are thus secondary and production rate finally falls only when you literally have no where else to extract i.e adding more lumber jacks does no good because they cannot be assigned to a tree to cut.
Thus in the case of declining EROEI coupled with rising production rates peak is reached when the resource is fully exploited i.e your close to 1:1 with extraction effort vs sources.
Another example would be say gold mines in a region. The gold sources are found and extracted once a mine exists for all of the gold sources then production rate matches the rate at which the individual mines are exhausted.
50% URR would probably occur well before the production peak. Obviously the exact numbers depend on the details but its clear that the production rate peaks after 50% URR and eventually declines quickly as each mine exhausts its vein and is shut down without replacement.
The logistic works very well in the growth phase but as with biology its not clear its applicable in the decline phase i.e it depends on what the exact drivers where for growth. If the constraint actually was the amount of resources remaining and effort was fairly constant then the decline will probably match a logistic.
But logistic growth alone does not imply logistic decline. You have to as I said know how EROEI varied over the growth curve to know the backside.
And last but not least if you have to search and the search rate is on the same order as the extraction rate then expansion of the search area serves to offset declining EROEI. Thus if your EROEI goes from 20:1 to 10:1 but you double the amount of new resource extraction sites then thats fine as long as the area being extracted or exploited grows its all good.
If four conditions are met.
1.) EROEI is declining
2.) Intensity or effort is increasing i.e you double the number of wells drilled or the efficiency of the well etc.
3.) The search is effectively over i.e the area being extracted declines.
4.) Production rate still increases.
Your in my opinion on the fast crash curve i.e production actually peaks at 70-80% of the real URR.
Certainly attempts to capture the exact curve are difficult because most measures mix in these four effects.
However given the decline is effectively strait down i.e double counting only shifts the curve slightly of vertical I'd argue that its not that important. A fairly large mistake in double counting only shift the curve by a few months. Lets say real production drops 50% in four years and a pessimistic calculation halves this amount and predicts 50% in 2 years. Well big deal I'd argue it does not really matter all that much if your down 25% or 50% in the first year. My best guess is if we are on a fast crash scenario then production will decline by 50% withing 5-10 years so you can see it does not really matter all that much if its 10% or 20% after the first year or so. You can be off by a lot and you still are sure withing 2-3 years that production will be significantly below peak. A fast crash implies that the last wells drilled will not be replaced as they decline thus the decline rate equals the individual well decline rate which for oil is on the order of 5-10 year.
This is pretty much black and white its either right or wrong even fairly large mistakes don't change the outcome.
In a sense EROEI approaching 1:1 effectively says the same thing no reason to continue you don't actually have any resources left worth extracting. I'd argue the inverse is more important i.e all of your high EROEI sources are now in decline the fact that you only have low EROEI is secondary.
Hopefully all this makes sense and yes in a sense there is some double counting but does it matter ?
I beg to differ with the general drift here. #1, no one is talking about CO2, which is blind. It may be the Oil Drum, but you have to consider CO2.
Otherwise, we just use coal energy to extract the oil, using perhaps electricity, or some other carrier to augment the EROI up to a feasible level.
I have nothing more to say, until this discussion goes real life, which is a point made earlier: carbon based energy use per capita has to drop, or capita has to decrease.
But that's unthinkable, so we play in the EROI sandbox.
"In the rooms the ladies come and go, talking of Michaelangelo."
Nate, you are on to something!
Double counting, yes and no, it depends. The Verhulst equation solves the wrong problem, and should be used only for "carrying capacity" solutions. There is a huge amount of double counting going on here as Verhulst diffEq derivation requires death and birth -- actually rebirth, which maintains the carrying capacity. This has been bothering me for a long time, and your framing puts the problem under a different light. That's why the Verhulst is misused so badly.
The real derivation that can give a Logistic under certain assumptions involves dispersive search and discovery -- this does not suffer from double counting as the search is exhaustive but only single pass. The Dispersive Discovery algorithm leading to a Logistic has been documented on TOD.
Factoring EROI into world production, how would the plateau of the last five years look like? Would there be any change in peak or/and intermediate peaks?
plateau of last 5 years is one example where money can turn into energy into short run (in long run you need energy and non-energy natural resources to procure energy). But high prices from world flooded with credit combined with 'belief' in fiat marker system brought more production online, (borrowing it from future years in my opinion)
Do you have the raw data for your chart?
In case I can get it, I'd try a different approach: I'd normalize E(out) at 100% each year, and plot the % changes in E(in) and/or the respective EROEI.
That way, I think we will arrive at a still steep but lot less steep cliff of our energy (oil) future. EROEI must be taken into account as a function of E(out) and E(in), and not a given.
raw data is just from EIA historical oil production and cutlers 3 datapoints.
Furthermore, a lot of those sunk cost infrastructure items are rusting away. A lot of them should have been replaced already, but instead we're just keeping them going for as long as we can. The fact that we are already losing the race against rust when we haven't even started down the "left slope" (or cliff) yet appears to me to be a very ominous sign. It does not seem to me to be unreasonable to conclude that to a very large extent, those infrastructure replacements simply are not going to be made, because we can't afford them.
One more nail in the coffin. . .
Yeah, the sunk cost element is an important one to keep in mind.
Combine this with the Best First Principle and you have an even worse problem. All that infrastructure built to transport and process light sweet crude will become/is becoming less and less useful and more and more dangerously fragile as it is pressed into service to carry and refine ever more acidic oil.
Dave, I think the simple approach is right. The point is not to pinpoint anything precisely but to point out that we are in deeper trouble than we might have thought. Just to add to the gloom, since we use energy to extract oil etc that energy also has an ERoEI and its Energy input has an ERoEi. These are quite small impacts when ERoEI's are high. As they get smaller the ERoEI of the EI becomes significant.
For instance when we get 5 barrels of oil by using one, it means that we had to use .2 barrels to get the one barrel for the EI. Therefor it really takes 1.2 barrels to get 5 not 1 to get 5. This further accelerates the decline.
Yes-which means an EROI of 2:1 is actually break even (1+.5+.25+.125+.0625 etc.etc.) as you state.
¿Is it really like BrianT says? I think that if EROI is calculated through a complete Life Cycle Assessment, this kind of loops should have already been taken into account.
I'd like to know Cleveland's view on this.
Net energy= EROI-1
So if the EROI is 5:1 you input 1 unit and get out 5, for a gain of 4. So break even is 1:1. Corn ethanol at 1.2:1 produces a gain of .2. In that example you would need to input 5 units of energy inputs before you procured one net unit of energy gain (6-5=1)
Trabirio, I have studied one detailed ERoEI study of ethanol. They did not consider the ERoEI of the EI. I don't know about other studies. The point however is that at high ERoEI's the ERoEI of the EI is a negligible part of the the final number. As the ERoEI's go down it becomes a bigger and bigger part until as Brian T says at 2:1 you are actually at 1:1 if you are using an EI that has the same ERoEI. Thus the curve accelerates.
Currently oil is usually extracted using oil so you have a still fairly high ERoEI on your EI. However solar is also using oil for its manufacture. The higher ERoEI of oil then has little affect on the ERoEI of the resulting solar power. When you run out of oil you have to use alternatives to create solar panel. If you use solar to create solar the lower ERoEI of the new EI brings down the final ERoEI dramatically.
re: Using Solar to create Solar..
I wonder what's been calculated for EROEI as far as using Concentrated Solar directly for process heating applications.. Instead of going through electricity, I would think some of the stages of PolySilicon refinement could be at least assisted with a direct heat sourcing. (With stored heat, I don't know the temps required or the storage media involved, but I'd imagine there's a way to do that, as well)
That is an interesting question, just at the most basic level. What is the eroie of Mirrors heating a tank of water? (Many details to determine before even starting that calc, of course..)
Brian, exactly, the lower the ERoEI the more the ERoEI of the EI of the Ei of the Ei etc matters.
someone has to say it:
"E-I, E-I Oh.....crap."
oh --- LOL :D
Al
Very good article! I've been thinking about the same issue and posted a similar graph in a comment not long ago:
http://www.theoildrum.com/node/5436/505751
Edit: the link to graph is broken. Here's the link:
http://www.panix.com/~dave/nwo/tod/tod4b.png
The net curve is just as you say, adversely skewed, and more cliff-like on the down-slope.
I believe there's another reason to think the bell will be skewed: later fields and regions become ever more capital intensive. This results in pressure to accelerate production in order to get an adequate IRR, recapture investment plus profit in sufficiently short time frame. This accelerated production, beyond that presumed in the symmetrical bell, also skews the bell.
All in all, there has been this presumption that the bell is symmetrical and that we'll have a gentle ride down. I don't think that's the case and am very glad to see the issue being explored.
One last note: there are a lot of tricky issues in deciding what to include and exclude in EROEI, in particular in energy invested. E.g. does one include military expenditures in procuring and "defending" energy resources? If one does that, the EROEI could been seen as a lot lower than 1:11 (in 2000) and less still now.
This is the issue with EROI research - clearly defined boundaries, and no, I don't think anyone has calculated the EROI of an energy source and included military expenditures as an input.
Dave: Great work as always!
I do not know of any formal studies that have tried to quantify the externalized energy inputs of military protection, but a study by Milton Copulus done in 2003 and updated in 2007 did attempt to put a dollar figure on them. Good grist for the mill:
America's Achilles Heel, The Hidden Cost of Imported Oil
Milton R. Copulos, President NDCF, October 2003
The Hidden Cost of Oil: an Update
Paper presented to new members of Congressional staff by NDCF President Milt Copulos
January 8, 2007
I have one fundamental problem with this approach (albeit I think the general idea is valid). However:
Based on the above, imagine the following. Let E(out) be a constant at, say, 100. Now let's assume EROEI declines drom 100 to 10 to 5 to 2 to 1
At EROEI 100, E(in) = 1 and E(net) = 99
At EROEI 10 , E(in) = 10 and E(net) = 90
At EROEI 5 , E(in) = 20 and E(net) = 80
At EROEI 2 , E(in) = 50 and E(net) = 50
At EROEI 1 , E(in = 100 and E (net) = 0
One way to look at it is the way presented in the article: as EROEI falls, E(net) quickly approaches zero. However, remember: EROEI is calculated. It is NOT a real physical measure of anything, it is something we can get by calculation.
So another way to look at it, is that while EROEI went from 100 to 10, E(in) increased by 9 (from 1 to 10) and E(net) decresed by 9 (from 99 to 90). When getting from 10 to 5, however, there is a change of 10, or roguhly the same amount -- in other words: when EROEI goes down there is a lot more E(in) to be sacrificed to get only the same amount of E(net) loss.
All in all: not all EROEI declines are the same. It is a lot faster for EROEI to fall from 100 to 10, than it is from 5 to 2... as there is an amount of r0 in E(in) to sacrifice (E(in) changes from 20 to 50). In my opinion it means that the EROEI decline will get a lot less steep in the coming years, as E(in) is likely to grow with E(Out) fixed at 100, bt it will take a lot more time to get from EROEI 10 to EROEI 5 than it took from EROEI 30 to EROEI 10.
I'm not sure I was clear enough, but what do you guys think?
I think your right. You need to graph E(in) and then fit a curve to that data. Then use that fit and recalculate EROI. I wrestled this problem myself in my EROI of Nat Gas post http://www.theoildrum.com/node/4376 The linear fit drops off too quick.
The trick is that we don't really know the shape of the E(in) curve. But there is also a minimum EROI we cannot really drop below and that is much higher than 1:1 (cover refining energy costs etc).
Yeah, I remember having read your analysis back then, and I liked it a lot. I'll try doing the same with worldwide oil production... but I have my doubts about its usefulness (i.e.: IMO there isn't any).
Mining of hydrocarbons will increasingly become a political problem, and it will not matter one bit what scientifically is (not) possible. It is a nice hobby... but the endgame will be determined by soldiers and not scientists.
Eastender,
What you are driving at is that there is a non-linear relationship between gross and net energy, i.e. very low EROI fuels exhibit an exponential relationship, which was shown by Euan Mearns in this post.
Eastender and Jon,
I think that EROI will begin to decline less steeply in the next few years as well, but I am a bit confused by what you say.
How else does one get an estimation of net energy without an EROI calculation? Industries report gross volumes, right?
What is the most dynamic variable in the EI factor?
Is the only real difference the energy required before wellhead?
It seems that all the other energy requirements other than maybe refining(because of crude quality) or separating the oil from water(because of high water cut) etc. would remain constant.
Unless the infrastructure needs to be renewed and that costs energy than I see your point.
The low hanging fruit oil was picked and now it is harder to get the next fruit but not necessarily harder to process it.
Cobblers. It is a ratio. You might want to think that ratios are "not real" but if you were on the wrong end of a plank hanging over a cliff, the ratio of your weight to that holding the other end down might just about have a very real effect on your life-expectancy in the following seconds.
(See end of The Italian Job for fuller explanation
http://en.wikipedia.org/wiki/The_Italian_Job#Ending.)
It is actually the ratio of moments (weight times distance) that matters. That is why I personally do not like EROEI. Net energy is important but EROEI is not a natural parameter for discussing the economics of energy production. The parameter (EROEI-1)/EROEI (I call it the energy utilization rate) which David mentions in his post is a natural parameter to use for such discussions, although information about inputs of other resources than energy are also required even in the simplest conceptual cases.
Great work, David -
As my Murphy's Law compendium says, "A simple, workable falsehood is more useful than a complex, esoteric truth."
The foregoing objections are true too, that net-vs.-gross is not as straightforward a calculation as EROI, that quality of energy (as reflected in market price) is as important as total joules out, and that we can't count the energy you used to get your hair cut on the way to work as a net negative, etc.
But then, we also can't easily factor in the complexity-driven "cost" of a critical piece of equipment or an irreplaceable worker, both of which can fall off the face of the Earth quickly and unpredictably as energy production slows and the economy gags.
So your basic linear model encapsulates what we already intuitively know: The decline in utility of FF-based energy will not track linearly with the decline in FF production - It's likely to be steeper, and therefore more chaotic.
Interesting post. Provides an interesting perspective.
Pluses and Minuses:
Minus: Comparing this to Hubbert's work is like comparing apples to oranges. I think Hubbert produced his work to give people a feel for volume remaining (personally I don't see it as predictive a tool as some people view it; and because the dates are off many people then tend to disregard the entire theory).
Pluses: Using EROI is certainly a different way of viewing our situation as it progresses over time. It might be good to give an example as to how the EROI numbers were arrived at to give a feel for the EROI effort (for example, back when, the effort for a 60 foot deep well might have given us 1,000,000 barrels, whereas today the effort for a 6,000 foot pipe might give us 110,000 barrels (just for arguement's sake)).
Ignorant,
The EROI numbers cited in this post come from Cutler Cleveland's work, which is referenced in the post. I have performed numerous other EROI calculations and have published on those as well. Here is an example.
The point I usually make is that Hubbert only knew these curves as heuristics. They did not spring from any first principles. (And no, the carrying capacity formulation of the Logistic does not count since oil does not sustain a "carrying capacity")
To do this correctly look at it from the perspective of dispersive discovery. The varying rates in search effort accommodate shoots of slow runners which pick up the backside of the peak, IF crude is what we are looking for. However, it could be that lower EROEI forms of fuel never went through a concurrent discovery phase and perhaps need their own discovery curve. My point is that trying to capture this in one curve may need some more deliberation.
Just posing the assumptions.
I guess I'm not used to seeing this in terms of EROI. It'll take me a while to totally digest.
However, Looking at EROI probably gives a better indication of when things will stop flowing than total volume does. So, I'm glad that you tackled this issue.
I look forward to your next update.
I think the more worrying thing that the comments touch on, is the notion of negative EROI on oil being "subsidized" in future by renewables, i.e. we'd essentially use a bunch of solar panels to provide electricity to power drilling rigs so we can keep pumping oil out of the ground.
The extent to which renewables will allow us to continue driving an ancient fleet of vehicles, has not really been thought about in the grand scheme of things. After all, isn't this essentially what plug-in hybrids are?
The important thing is, we use oil for other things (most notably plastics), and so using renewable energy to pump out oil for these purposes is not necessarily a bad thing! The problem is, can oil-from-renewables be set aside for building things, or will it just be too tempting to burn it in our cars? History would suggest the latter is a more likely scenario.
I believe it was Tesla or Edison (can't remember which), who commented that it would be an awful shame if we had to burn through all the world's oil using internal combustion engines, before we bother to develop electric cars. I suspect the same will happen with renewables... it will be an awful shame if all we accomplish by building wind and solar farms is the ability to extract more oil!
Virgil, currently renewables are being subsidized by oil. As the quantity of oil and its ERoEI go down how will renewables be able to subsidize oil???? I doubt that ANY of the renewables are going to be feasible without oil - for one thing raw materials for high tech renewables are often in other countries thus a military and transport system needs to be maintained to get them at a cost that makes our renewables viable - mainly by subjugating the populace that is mining them so they will mine them at dirt cheap wages. More important that platics how about the oil used in roads. Then the transport. While I have learned that some big mining machines do run on electricity, they run on super duper extension cords. No electric 18 wheelers to my knowledge yet to move stuff to and from solar panel plants.
At any rate this points back to my post about the ERoEI of the EI - as long as the EI for wind and solar is oil we have a postive ERoEI - when the EI for wind and solar has to be wind and solar I expect they will quickly be shown to have very small to negative ERoEI's.
A more cost effective alternative to subjugating resource rich contries with force is to help establish decent rule by law and preferably democracy and then trade the resources for your own speciality goods.
Then you only need local decent police and no garrisones and if there is a piracy problem enroute you got two good bases to handle it from instead of one and two sets of populations supporting the effort.
Good point! The energy required to get lithium out of the ground (not that there's enough to make all the batteries for an electric car fleet, but that's another story) is staggering! Silicon is pretty easy to make (just go down to the beach and get some sand). Copper for generators and turbines is another matter however.
Ayres's has some work on how machines started out terribly inefficient. So even though we had this great resource, the cost of moving goods was high. So if we mix that inefficient machines idea that puts a major crimp on the upslope, plus your EROI curve chopping the downslope, we would end up with a very narrow spike. A very short "golden" period where oil was cheap to recover and machinery was efficient. And that built the highway system of the 50s and 60s. Then I expect we started to lose ground. OPEC pushed up the price faster than EROI did.
I don't think transport is as efficient as it could be by a long way. Well-head to end use (what ever that turns out to be, for example transporting people from point A to point B) could continue to become more efficient, if we simply dump the SUV, start building single seater vehicles capable of more than 100mph, or redesign society in a way that reduces the demand for personal transport. However, that is a much wider discussion than this thread is covering. Reduced demand by greater efficiency is always possible but suffers from diminishing returns as social complexity increases. We cannot outrun depletion in the long term.
I have to second the efficiency comment and actually say it is an understatement.
The typical internal combustion engine is only about 30% efficient in terms of converting chemical energy to mechanical work.
Most is exhausted and radiated as heat. Then there is your point about just trying to increase the efficiency of the current designs which I think would take a lot of pressure off this dilemma. We definitely have a lot of fat that can be trimmed to ease the pain.
Have you seen the Volkswagen 1 Liter?
"Have you seen the Volkswagen 1 Liter?"
I have, it's a fascinating device. It could be built as a kit car if anyone had the inclination, and the cost of materials would be cheap enough to make it a workable vehicle for around town and commuting.
But of course the customer will demand something more realistic, more comfortable, more "mainstream".
Take the Mercury Milan hybrid. A comfy small sedan, stylish, and 42 miles per gallon. Within 3 years, it will be able to easily be built as a plug hybrid, offering potentially well over 75 or 80 miles per gallon.
What people are not accounting for here on TOD is that oil demand will soon begin to drop, and drop fast and hard. Even if the economy recovers nicely, the oil consumption will still continue to drop in the OEDC nations. China and India are often held out as examples of places where oil consumption will rise, and it probably will for a short time, but the newer efficient technologies are coming to them as faster as they are to the developed world. China is already prepping the plans to sell plug hybrids as export items, with Warren Buffett as an investor.
Oil production MUST decline in the next decade whether or not the oil is "out there" somewhere, because oil consumption will almost certainly decline and perhaps by staggering amounts.
We have not even included upcoming carbon taxes and regulations worldwide in the above calculation, which will force the increased use of alternative technology even faster. The Saudi Arabians have so far shown NO FEAR of not being able to produce enough oil. They have shown signs of outright terror at the prospect of collapsing demand.
RC
I am new to this Peak Oil issue and most of what I have learned is either from this sight or leads obtained from like sites.
Intuitively, it seems your ideas about how things will unfold are most likely.
No one is just going to keep barreling along full tilt...........they will adjust as much as possible whether it be simple ride sharing or better trip planning.
Eventually new more efficient vehicles will replace the SUV and mass transit to some extent will also help.
It seems to me that if Americans just became more energy frugal and planned how and when they drove we could reduce fuel consumption by 25% over night. All just gut guesses but I do see how incredibly wasteful people have become.
Another thing is that the 1 liter type vehicle could be used as a primary transport and you could still keep a pick up in the garage for the real load.
So many trips are just one person going here or there and dragging the bulk of the family truckster along makes no sense at all.
I have a question. Is US production quoted by the EIA at 5.3Mbpd inclusive of the 1/11 EROEI or not? I assume it's a net figure after whatever form of energy has been used to extract it, but maybe I'm wrong.
Of course not. ALL EIA numbers are gross, the only cost they allocate is dollars.
(and oil is a minor part of energy input into oil - it is a large % natural gas and electricity - though this data too is hard to find)
http://www.reddit.com/r/energy/comments/8unly/the_net_hubbert_curve_what...
http://www.reddit.com/r/collapse/comments/8unm4/the_net_hubbert_curve_wh...
http://www.reddit.com/r/Economics/comments/8unm9/the_net_hubbert_curve_w...
http://www.reddit.com/r/science/comments/8unq2/the_net_hubbert_curve_wha...
http://www.reddit.com/r/reddit.com/comments/8unuw/the_net_hubbert_curve_...
spread this around folks, if you are so inclined.
Though I will be traveling, I think a great follow up post would be "What does it mean if everyone on slashdot, reddit and digg understood the Net Hubbert Curve?"
;-)
Strictly speaking, we don't use oil to get oil, but oil's refined products, along with other finished products given various energy inputs, to get oil. In that vein when looking at EROEI we should probably look at refining and transportation as well.
The ratio of energetic outputs to inputs for current refinery practices puts EROEI at ~6:1 at most, so while an increase in the energy cost of extraction certainly reduces oil's EROEI, it hasn't done so by much given the low EROEI of refining.
The higher EROEI of extraction in the 1930s was probably offset by a much lower EROEI of refining, and probably transportation as well. Odds are, oil has been at or below ~5:1 for the past hundred years given the use of it's refined products.
Nice presentation!
I think that perhaps there has always been more focus on "peak oil" when declining EROEI has, in my view, been the elephant in the room. There will be plenty of oil left in the ground when the industrial age is on its death bed a few decades hence, but it will not be economical to remove most of it.
The low hanging fruit principle seems to apply to all limited resources, not just fossil fuels. What is easiest to find is always what is found first, and as that is depleted, the next easiest is searched for and found, with progressively increasing energy being expended as the exploitation curve matures. The function that describes the increasing cost may be a simple compound growth curve or it may be more complex, but if it is more complex, I suspect that it will ultimately yield an even worse picture of the future than a simple compound growth curve.
Cleveland's numbers suggest a 3% compound rate of growth in "cost" which would place us at about a 9:1 EROEI today, meaning that 88.9% of each barrel is still available for other purposes than acquiring more oil, and by 2030 those numbers will be down to 4.76:1 and 78.97% respectively.
Let us not forget that another significant factor is the history of oil exporting nations after they hit peak production. Their exports decrease at a faster rate than their production. This means that for the US, importing more than 60% of its use, that it may take only 15 years after peak world production for its imports to fall to very low numbers. So if you think figure 3 depicts a bleak future, note that for the USA and other importing nations it could be worse than the chart indicates.
Remember that other types of energy can be economically used to leverage oil recovery. e.g., solar and nuclear are being proposed to extract bitumen. See:
Solar assisted method for recovery of bitumen from oil sand
Toward Sustainable Production in the Canadian Oil Sands IndustryAnthony Halog, Albert Chan.
Nuclear Technology and Canadian Oil Sands; Integration of Nuclear Power with In-Situ Oil Extraction
How are solar and nuclear energy considered in your EROEI calculations?
If you count the solar input, then conceptually EROEI could be < 1 while still giving an economic process with high prices transport fuel and cheap solar energy.
Or just use the electricity directly in transportation:
Electrification of Transportation (Drake)
http://www.energybulletin.net/14492.html
"How are solar and nuclear energy considered in your EROEI calculations?"
They are not. A simple calculation of 3% compounded cost increases beginning in 1930 yields the numbers that match those quoted for Cleveland, and thus by extension, the numbers I quoted for today and 2030.
Figure 3 in this thread indicates that the wolf is at the door, and that there is no significant time to outrun him.
There are always better ways to skin a cat, within limits. The methods you point out may (or may not) be the better ways, but do they stop the progression of 3% compound cost increases or do they just prevent that rate from going even higher? Certainly the Canadian sands are an expensive proposition which fits right in with the overall concept that the low hanging fruit is picked first, and only later (now in the case of the Canadian sands) is the hard to get (expensive) fruit plucked.
I agree that the reduction in EROEI is significant but statistics point of view can make the example more or less startling. The difference between 100:1 and 11:1 is startling; almost 10 times.
OTOH this is essentially the same statistic: In 1930 it cost one barrel of oil to get 100 barrels of oil. In 1970 it cost about 3 1/3 barrels of oil to get 100 and in 2000 it costs 9 barrels of oil to get 100 to the market.
Politicians (Democrates included) or economists will say, "Geeze, everything has gone up since 1930. Eggs were 10 cents a dozen in 1930 and now over a dollar. We should be more interested in peak eggs ... ha ha ... so what's new?"
Isn't it amazing what you can do with statistics?
Lynford,
Costs have gone up in large part due to inflation, so are you suggesting that energy used to get energy is inflated?
"Are you suggesting that energy used to get energy is inflated?"
Of course not ... what I am showing is that some politicians and analysts can use the same statistics and make a joke from a serious matter. Similar warped logic (??) is done quite often and is just one of the reasons that I am a confirmed 'Doomer'.
How big is your garden?
Lynford, the value of the work done by energy remains the same over time, (except perhaps in any efficiency gains in the machines that use it). The value of goods a dollar can buy does not. However the energy value of the dollar remains about the same - the energy value of a dollar is how much heat is produced when it is burned. :) How much oil it can buy is another thing.
By the way the energy value of an egg is the same as it always has been. http://www.thecaloriecounter.com/Foods/100/1123/4/Food.aspx A large egg is about 74 calories. The price of the egg has nothing to do with the energy embodied in the egg.
I saw a picture one time from the twenties. It was of a group of a dozen nicely dressed men standing in front of a filling station. "Gas 25 cents a gallon" The caption read, "Not one man in this picture makes 25 cents per hour."
From "The Grapes of Wrath" read about a 15 cent man.
http://www.enotes.com/grapes-of-wrath/q-and-a/from-grapes-wrath-what-25-...
Makes one think, doesn't it?
Of course my original comment had to do with statistical distortion use by politicians and little to do with here and now reality.
Assuming eight dollars and hour because of minimum wage laws then this works to be about 13 dollars a gallon.
Even for those that offer lower wages say half or 4 bucks and hour it would be about six bucks a gallon.
And of course during the depression oil production was increasing.
However this gives you a real world dynamic between gasoline prices and wages. Thats 25% to 50% your daily wages if you used a gallon a day. However obviously your not driving to work by your self for a low end job under these conditions. Figure say 1/2 a gallon a day or 1/4 with carpooling and variants. This gets it down to 25%-6% of your wages all things depending. Its doable.
To anyone:
Does solar thermal make a discussion of EROI irrelevant beyond the EROI of solar thermal?
Any longer term resource constraints on solar thermal beyond the years necessary to build plants and a better grid?
There are 5800 solar thermal project now worldwide and I think the cost is .13-.17 KWH -? (more cost than wind at .08? but a practical very long term solution?)
WSE:
This question might be better placed on the Drum Beat section of TOD. But to give a partial answer, wind is somewhat more consistant that it blows at night too. Thermal Solar is fine as long as you have a heat sink big enough to go for a few days of clouds and avoid the day/night cycle. Both have high up front costs and low running costs.
Any guess at future consumer prices is never valid. IF the grid electical cost is 20 cents per KW then wind and solar will cost 20 cents to the consumer even if the origination costs are 5 cents and the wind mill or solar owner will make a lot. If the grid cost is 5 cents, then the wind and solar price will be 5 cents or they will stand down if they cannot provide at that price. Once the project is built, I would immagine the fixed cost of either wind or solar would be very small. Same with a gas or oil well once it is drilled and producing.
BTW: I was at a customer's place with a big PV solar system and their electric bill for May was a check from the power company for $25.
This is getting silly IMO.
According to the latest wrinkle in theory of EROEI, EROEI= 'useable' energy output/ 'useable' energy input.
This is about the same as energy dollars out/ energy dollars in.
In 2008, the world produces ~55 trillion US dollars with an energy input of 18000 Twh, 30 Gb of oil and 100 Tcf of natural gas.
Assuming the price of $75 per barrel oil, that's $2.25 trillion dollars.
Assume $.1 a kwh, that's $1.8 trillion dollars for electricity.
Assuming $10 per 1000 scf, that's $1 trillion dollars.
Total $5.05 trillion dollars for $55 trillion doillars of world GDP. EROI=55/5.05=~11
Oil production in 1970 was 42 Gb and prices were $4 a barrel
Electricity production in 1970 was 5500 Twh and prices were about $.025 per kwh
Natural gas production was 45 Tcf and prices were $1.3 per 1000 scf.
The world GDP in 1970 was $2.5 trillion dollars.
Total is $ 302 billion dollars to produce $2.5 trillion dollars. EROEI=2.5/.302= 8.3.
So in the past more energy produced less GDP.
EROEI is rising slightly not falling at least by these measures.
Improved efficiency and better technology explains most of it.
But higher 'efficiency' can't help us with depletion.
IMHO, EROI is simply the wrong metric.
IMHO you are the wrong poster to be commenting on EROI.
But since you brought up 70s vs today, I suggest thinking about the fact that energy and natural resources drive the economic engine - dollars are just a marker. We have SHARPLY departed from the historical relationship between global remaining oil and global notional money supply:
US Treasury Debt vs yet-to-produce URR of Lower 48 (based on HL)
This is excellent commentary and I am very worried about the overall conclusion of the article. However, I was wondering if perhaps there were SOME reasons to be optimistic that are not properly accounted for here? That is a question, not an observation.
Perhaps to stimulate discussion, I will mention a few possibilities (however uncertain) to be somewhat less pessimistic about the future (or perhaps "more optimistic"):
1) Much of the input energy in the EROI calculation in not in the form of difficult to replace liquid fuels (as already mentioned above)
2) Much (a majority?) of the energy being used by people in OECD countries is being expended for unproductive or even destructive uses (e.g. driving to the grocery store a few blocks away, when walking or biking would be less energy intensive and more helpful for the people involved, or cutting down forests or flying to distant vacation spots or cooling houses to 21C during the summer, consuming vast amounts of dairy products when vegetables are healthier and less energy intensive) Might it not be "better" for society NOT to waste that energy on those less than productive pursuits?
3) The lack of a viable alternative may force society and governments to reexamine alternatives or promising research that was discarded for inappropriate or inadequate reasons (e.g. Thorium reactors, breeder reactors, cold fusion, etc.)
So although it seems clear that governments and most people are taking the present relative availability of fossil fuels for granted, perhaps there are some mitigating factors that would reduce the disastrous impact of the graph that you present.
IWylie
your points 1 and 2 are accurate. point 3 involves the additional variables of time and equity - the longer time and less affordable energy is to masses, the more that natural decline will overtake. The real positive is we don't need all this stuff/energy/consumption to make us happy - the real negative is that we have ginormous sunk cost infrastructure attached to this way of life.
There is also enhanced oil recovery -using CO2 miscible gas flooding, for example, depending on the field you can get up to 50% of OOIP vs 30-35%. So that is a plus - but we need a floor on prices for this to be scalable..
Reasons to be optimistic? How about the prospect that the econosphere might collapse before it destroys the biosphere rather than after?
At least we can say that we need some minimal amount of energy/time to drive the world economy. It's not like *more energy consumption always means proportionally more GDP, or that less energy consumption means proportionally less GDP. Supposedly, energy intensity has dropped by nearly forty percent since 1990, and people are making due with less energy to do the same stuff in terms of economic activity.
A great example is using renewable energy to power personal transport. Given the huge oil (refined products) and nat gas inputs needed for oil production, as well as the poor efficiency of ICEs over standard driving cycles, we would see a conventional vehicle at about 1500Wh/mile while with an electric drivetrain, powered by renewables, the very same vehicle could easily be at ~300-400Wh/mile. Does using less energy to do the same thing mean GDP will drop? Of course not. In fact, it stands a pretty good chance of increasing as a result.
*W/ everything expressed per capita.
Yes. This is, basically, the Ayres-Warr find - that it's "useful work" that matters. The implications of that find is being explored, the most recent installment is The financial return on energy invested
.
Nate, exactly correct. What we see by your chart is something we all know but have to be reminded of: Creating GDP can be done with a pen and a bit of "fuzzy math". Producing energy takes real work, hard work and real thought. Price is no indicator of peak, the price can be moved about by all sorts of hysterias. dollar value of oil tells us more about the value of the dollar and the price of our fears than about remaining oil available.
RC
It is becoming quite obvious now that the USA reached its own peak in terms of national greatness (or imperial power or however you wish to describe it) in the late 1960s/early 1970s. The moon landings were perhaps a fitting symbol.
Then, in rapid succession, US oil production hit Hubbert's peak, inflation took off, we went off the gold standard, the Arab oil embargo hit, the economy went into the tank, we had the whole Watergate scandal, and the fiasco of Vietnam finally ended in total humiliation. I would argue that the US has really been in decline ever since. The decline continues in domestic oil production and growth in oil imports, the growing budget deficits, national debt, and trade deficits, the increasing tendency to get bogged down in overseas quagmires, the decline and offshoring of US manufacturing, a growing backlog of deferred infrastructure maintenance, declining educational performance, stagnating household real incomes for anyone below the top 10%, etc., etc. We are just fooling ourselves (or, more accurately, have been systematically fooled by political and corporate leaders and the media) into thinking that with Reagan the '80s were "Morning in America" and that the country has been ever since on an onward and upward path, with just a few dips along the way (including the present one). No, the reality is that the nation has been in real decline, it continues to be in decline, and the pace of decline will only speed up in the near future.
But WNC, don't you know? "It's morning in Amerika!"
First, "this is about the same.." - It is not. Second, what is your source or to what are you referring when you say "useable" energy output/ "useable" energy input"? Third, www.earthtrends.org has the inflation-adjusted 1970 world GDP at 12 trillion dollars. SO, using 12 instead of 4 as the world GDP in 1970 means that the EROEI that you calculated (that actually isn't EROEI) is 40:1 in 1970 and 11:1 in 2008, numbers that are surprisingly close to 30:1 in 1970 and 11:1 in 2005 as reported by Cleveland (2005).
Then you should inflation adjust the price of energy and your alleged difference goes away.
World GDP went from 2.5 to 55 trillion unadjusted--22x.
The price of oil went from $4 a barrel to ~$75 a barrel--18.75x.
Take energy of today at $5 trillion dollars and discount it to 1970 prices at 4%(like earthwise)
and you get 1.126 trillion dollars for energy; $5/(1.04)^38=$1.126 billion which is 2% less than what I calculated at $1.15 billion out of $55 trillion GDP.
You folks are going to go nuts trying figure out your declining EROEI of 40:1 to 11:1.
The EROI was about the same as today ~10 as in 1970 maybe a little bit less,
JMHO
David Murphy,
I think you are SPOT ON with your analysis. Yes, it might be SIMPLISTIC, but we must remember, EINSTEIN with E=MC2, made K.I.S.S (keep it simple stupid) his halmark. I would like you to comment on another aspect of EROEI. And that is its FINANCIAL COUNTERPART, the US DOLLAR. We know that since 1933 the US DOLLAR has lost 95%+ of its value. Of course this is partly due to dropping the US DOLLAR from the GOLD PEG, but wouldn't you also agree, the INFLATION of the US DOLLAR is INVERSELY related to the reduction of EROEI from 100:1 in 1930 to 10:1 or less today. That is a 90% reduction of EROEI.
Many people see the INFLATION or LOSS of BUYING POWER of the DOLLAR as merely a MONETARY PHENOMENON reacting inside a Vacuum. I rather think the loss of VALUE of the US DOLLAR (world currency-not much longer) has been measured by the loss of EROEI in GAS and OIL.
What are your COMMENTS?
We all owe David a big thank you but it's hard to say thanks to messengers who keep bringing bad news and sound like you mean it!
"They" are liable to stand us all against a wall one of these days as an example to those who question the king's new wardrobe or go around inciting riots.
Seriously a question for anybody:
Is there any real likelihood that ma and pa operators will be able to work the marginal or dying fields in the rest if the world the way they do in the US?
This could have a fairly serious impact when things get really tight ,could it not?
The cliff would not be quite as near to vertical.
I'll take a stab at it mac. OTOH, "ma & pa" operators would have a wide range in meaning if you think globally. In the US these micro-operators have access to the same technology that ExxonMobil has through our vast system of domestic oil field suppliers and service companies. To some degree they are subsidized by the big players. I might pay $100,000 for a service provided to XOM but get it for $40,000 for M&P. The service company can cut me a deal because they have the cash flow from the big guys. Now jump to a field in 3rd world country X. The state oil company has a monopoly on the services from 3rd parties. Probably won't get the same cut rates for the local M&P Company. But this is probably a small factor.
One big factor is ownership. Again assuming the resources are owned by the state the local M&P have no access to those fields. The state system would have to give up a portion of its control to allow these new players in. Always possible but not as easily done as in the US given how much of our resources are in private hands. Here a landowner can be motivated to trade with M&P even if it only gets him a check for $200/month. Probably not a lot of gov't would take on such efforts for such small amounts especially if it means giving up direct control. Capital availability is another factor. Many local sources available to US M&P. From what little I know about global capitalism the lack of such small capital providers is one of the biggest road block for all micro-efforts and not just mineral extraction.
And perhaps the biggest road block is just the lack of skilled oil field workers who have the ability/desire to manage such operations. Though it's easy to think of M&P as some toothless redneck sitting under a tree watching a pump jack go up and down, most of our M&P operators are highly skilled/experienced folks who have spent half of their lives doing the same job for a big players.
The short answer mac: No. IMO it’s not the available of stripper production that produced our M&P operators as much as it was a cultural phenomenon fairly unique to our country. There might be a few isolated areas in the world where we could find all the factors come together as they have in the US but I doubt it would add up to anything close to meaningful.
Anyone interested in another approach to this issue (he calls it Available Energy) should check out the posts of shortonoil over at PO forums. His math seems a bit more sophisticated, but the conclusion is about the same--though we are roughly at peak oil (when half the oil is left), we are well past peak available energy. Only about 12% of the original available energy is left.
Thanks David!
Figure 3 just what I was hoping for a while ago, here.
Only minor suggestion if you update it:
Instead of just saying "73% of the net energy available is already used."
Show horizontal scale of % remaining, at each 10-year interval.
Since I do not have the time to read all of the comments today, I apologize if this criticism has already been discussed. Concerning figure 3 the steep slope of the falling edge of the Net Hubbert Curve assumes that crude oil is the energy used to bring the crude oil and its refined products to market. In fact natural gas and electricity (produced from a variety of sources) are commonly used. For example, electricity runs refineries and gasoline pumps while natural gas is used to process tar sands. When called upon to supply more energy to process crude oil, these other sources of energy may not be past their peak production rates. Therefore declining ERoEI will not reduce the net amount of crude oil as much as the graph predicts.
Its also worth considering that as this is happening, the cost of the things that the oil industry needs will increase both because of the increase in the cost of energy, but also due to the depletion of other natural resources, e.g. iron ore.
Paul,
Try and think of money as a mere 'proxy' for real stuff or simply as our chosen proxy for 'getting things done'. In the old days that was Gold and farm labour, now its paper/digital and designer handbags, but while we continue to consume real stuff it all boils down to the need for energy of some sort or other.
Commodities are also a proxy for energy -both in the real physical sense of E=MCsquared and because they take energy to extract. No one would dispute with an infinite amount of energy we have massive more resources but as with oil we have picked the low hanging fruit and energy prices/availability is going to be a key determinant going forward on how much stuff we can continue to extract.
What this implies to me is that increasingly large chunks of our remaining effort (translated through the proxy of fiat money) will be used up in seeking and mining those resources that are essential to 'keep the machine going' rather than provide a 'pleasurable lifstyle'. Since money is not a real entity and is valueless in and of itself (paper) we are likely to see 'prices' payed for those real-world things that are valued or non-discretional rise very fast. E.g. £5000 for home energy in 2020... In the meantime 'designer stuff' or luxury holidays -while not dissapearing completley- will become what they once where 'luxury' items afforded by the few... (Ask yourself if there had been credit in the 18th century might there have been a few more Faberge eggs made? :o)
Have a look at these 'Sankey Diagrams'to 2050:
http://europe.theoildrum.com/node/5316/
-also have a look at my 2007 paper sections on comms. & finance (needs an update):
http://www.megatrends2020.com/Peak_Oil__Joining_The_Dots.doc
Welcome to TOD btw.!
Regards, Nick.
I quite agree that the practical availability of energy as you approach natural resource limits drops off quite sharply due to increasing costs and is a most important principle. My post on the same subject, "Profiting From Scarcity" focuses more on the other half of the affordability of energy issue.
That "other half" is the increasing overhead of the economic system the energy resources need to support. When you then include all the exchangeable energy resources in addition to oil the measure that combines the decreasing energy returns and increasing system overhead costs, call it TROI is the true combined measure of the physical availability of economic energy.
It has an even sharper drop-off toward vanishing returns as you approach natural limits, crossing lines of zero profitability for economic sectors with excessive overhead, is partly the issue.
Our societal inclination is to continue spending as if here was no limit, while increasing our effort and creativity in exploiting resources, as nature escalates the resistance to that. We act as if to break through a barrier, amounting to a suicidal tendency sure cause of societal collapse as a direct conflict with our need to be responsive to limits instead.
Our society presently finances its increases in overhead cost commitments based on an assumed perpetual compound growth in energy availability. That's done by borrowing in relation to projected growth using a model of perpetual growth (until proven otherwise). That's a real bad plan, is the point, because it leaves us overshooting and shedding vast amounts of societal overhead costs as a way of adapting to limits, rather than staying away from such thresholds of sustainability.
I think it could all be modeled and used for steering the system. These are the questions the model makers need to ask.
Thanks for this contribution, which sounds logic.
But this contradicts with the historic experience of the rather symmetrical depletion and substitution curves of other resource types, for example regional coal resources:
Coal which should have the same ERoEI problem. And perhaps I should note that only 143 years ago there was the same nervousness about the coal resource depletion in the UK:
William Stanley Jevons in The Coal Question: An Inquiry Concerning the Progress of the Nation, and the Probable Exhaustion of Our Coal-Mines, 1866
All previous energy transitions were from lower to higher energy yield sources.
"In our own day, we must eventually move to lower grade energy
resources as we slowly run out of oil. Therefore, we might expect
the transition from oil to oil alternatives to be a decisively less
successful energy transition than previous energy transitions in
history, since all the previous transitions were from low grade to
high grade energy resources, and the coming oil transition is from
a high energy resource of oil to lower grade energy resources."
-- Professor Douglas Reynolds
In one year the entire world produces about 1 cubic mile of oil (2006 data). It would take 50 years of energy production by each alternative energy source below to accumulate the equivalent energy in 1 cubic mile of oil that the world uses now in one year.
The illustration would be easier to understand if the figures were multiplied with 50 and the "each year for 50 year" text were deleted.
Hi Magnus - that illustration stems from a key-post on TOD from Feb 2007 here : http://www.theoildrum.com/node/2320 , so the numbers/year is to add realism to the task.
Original background is from this article on Spectrum :
http://spectrum.ieee.org/energy/fossil-fuels/joules-btus-quadslets-call-...
It is more complicated than that, because those different alternatives have different expected useful lives. Furthermore, some (coal, NG) have their own depletion issues.
The realistic conclusion is that as that one cubic mile/yr of oil shrinks, at least part of the depletion is NOT GOING TO BE MADE UP by anything else. We are simply going to be giving up that use, and the things that it was used for.
What we really need to be thinking about is identifying the REALISTIC and REASONABLE parameters for a build out of renewables, and figuring out how we can get the most essential uses to fit within the limits of the energy that those renewable resources can provide.
Thus, if we figure that we have a realistic chance of building out wind + solar + hydro + biomass + geothermal + tidal to an extent that provides - say - 10% or 25% of our present FF flow, and that this much can feasibly be done even given a declining economy starting now, then we would need to figure out how we could make the best possible use of these limited resources to provide the the most essential energy services. Any use above and beyond those minimal essentials will thus define the things that we will have to be prepared to give up during the transition to a renewables-only economy. We may not like it, people can throw all the tantrums they want, but this is reality, and the sooner we face up to it, the better. When the fossil fuels are gone (effectively, to the extent that it is too costly to get what remains), we will have no choice but to live within the means that our renewable resources allow.
If I remember correctly that graphic is slightly misleading due to usage efficiencies.
On the other hand, when you consider the amount of energy we put into producing and using a cubic mile of oil the alternatives look much better. Picture Manhattan with oil up to the tops of the skyscrapers. That's a %$#@load of oil from a purely material standpoint.
If we put half the energy into wind and solar that we do into oil we would be sitting pretty.
It's pretty off... Depending on the app, electricity from renewables can be used at ~2-5 times the efficiency of oil's refined products.
Oil (finished products) is at a ~5:1 EROEI, and as you mentioned, there's a ton of energy to invest into renewables that will provide about two to five times more useful energy and have about three to five times the EROEI. Ignoring of course efficiency improvements and the like, especially wrt energy use in buildings.
Lets consider the solar panel in isolation:
91,250,000 x 50 = ~5 Billion panels.
-So roughly speaking if a panel where bought each year for everyone on Earth that would do the trick...
(and before anyone says most people can't afford it a couple of days ago there was a post about a poor peasant man from India who saved up for his $350 dollars to buy a solar panel.)
...and then we consider that this is only one item on the replacement wheel -of course the biggest one is not shown and that is efficiency and not wasting the cubic mile in 10mpg Hummers to take the kids to soccer practice...
In reality we havn't even scratched the surface of what could be done because nobody (by which I mean 95%+ of the population) even realizes there is a problem yet and so there is no political or personal will to do anything/change...
The real danger, IMO, is if we do decline it will be masked as lack of demand or some other proxy for the real issue -which is a decline in relatively cheap, flexible and freely available concentrated liquid energy.
Nick.